A Tale of Two Landscaping Brands: What Structural Mapping Reveals About Growth, Risk, and Differentiation
- Feb 7
- 3 min read
Updated: Apr 28
Brands in saturated service categories often look the same on the surface.They offer similar services, operate in the same geography, and compete for the same customers. But beneath that surface, they are built very differently.
The Journey Compass is a diagnostic system designed to map those differences. Rather than defining what a brand is, it measures how a brand behaves across four directional forces:
North: pressure
East: precision
South: perspective
West: conditions
Every brand expresses all four — but in different proportions. That imbalance determines how a brand grows, how it competes, and where it becomes vulnerable.
This case study compares two landscaping companies operating in the same Tucson market. Not to determine which is “better,” but to interrogate how each brand has been built to win customers, retain them, or lose them.
Brand Snapshot
Company A
Commercial landscaping provider (HOAs, multifamily, commercial properties)
Contract-based, recurring service model
Growth driven by reputation and relationships
Full-service, in-house operational system
Company B
Residential-focused landscaping service
Lead-generation driven model
Growth driven by search visibility and accessibility
Broad, generalist service offering
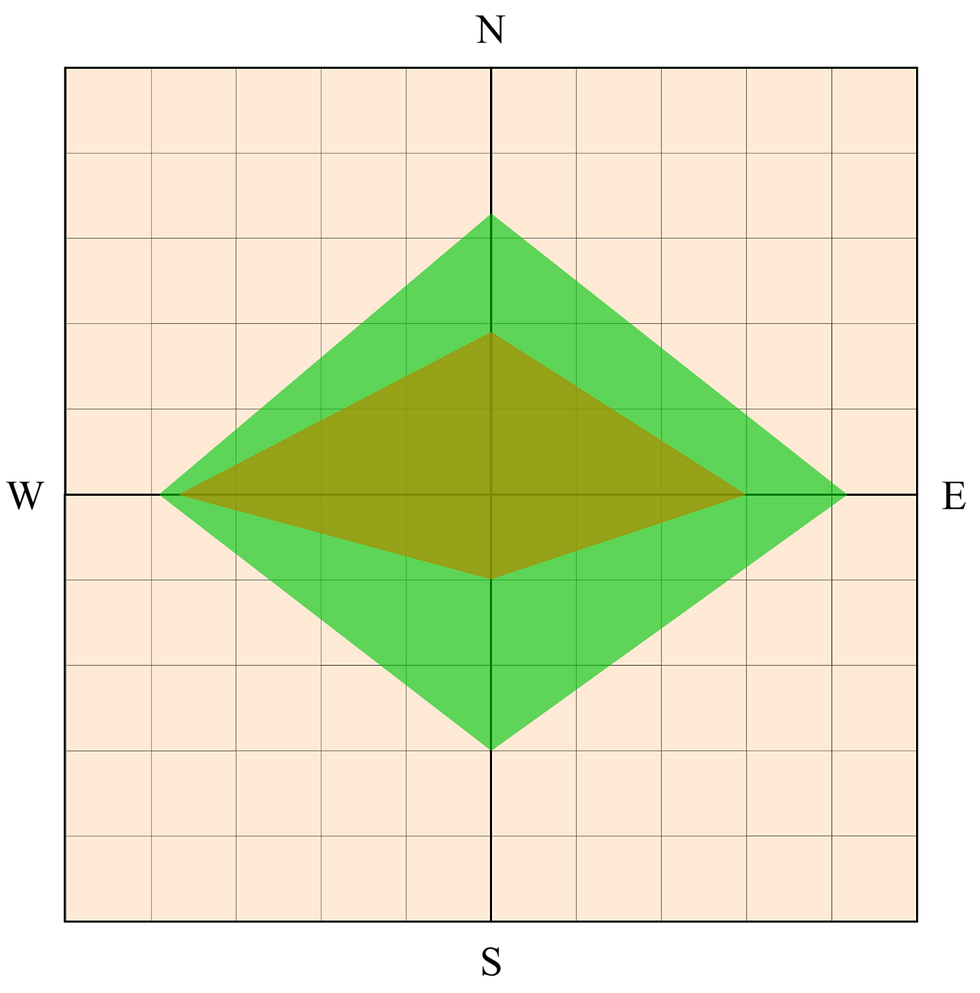
North | East | South | West | |
Company A | 17 | 21 | 16 | 19 |
Company B | 9 | 15 | 5 | 18 |
Compass Signature (Company A)
Primary: East
Secondary: West
Supporting: North and South
Compass Signature (Company B)
Primary: West
Secondary: East
Weak: North
Minimal: South
Company A is represented below in green, with Company B shown as the smaller brown shape. These polygons are referred to as a brand’s compass shape. Each of the shape’s four points corresponds to the score in each of the four areas of the compass, as detailed above.
Structural Contrast
System Type
Company A: Execution system with embedded values
Company B: Demand capture system with functional structure
Growth Engine
Company A: Retention, reputation, operational excellence
Company B: Acquisition, visibility, accessibility
Differentiation Mechanism
Company A: Internal standards and trust (partially implicit)
Company B: Availability and breadth (externally visible, but shallow)
Customer Relationship Model
Company A: Long-term, trust-based, high switching friction
Company B: Transactional, low switching friction
Brand Memory
Company A: Felt through experience, not fully articulated
Company B: Barely retained beyond the transaction
Compass Stress Test
What happens if both brands continue scaling without structural adjustment?
Company A:
Differentiation remains partially invisible
Meaning is felt, but not leveraged
Growth becomes constrained by perception, not capability
Company B:
Increasing commoditization
High replaceability
No defensible edge beyond visibility
Shared Tension
Both systems are incomplete — but in opposite ways:
One has depth without amplification
The other has amplification without depth
Strategic Implications
This comparison reveals broader truths that extend beyond landscaping.
1. Efficiency is not differentiation
Operational strength creates stability, but without meaning or performance identity, it does not create preference.
2. Visibility without meaning creates fragility
Demand capture can drive growth, but not retention or loyalty.
3. Meaning without expression limits scale
Internal values are not enough, because what is not visible cannot differentiate.
4. Strong brands balance acquisition and retention systems
West drives discovery
North and South drive loyalty and advocacy
Sustainable brands require both.
Directional Recommendations
Company A:
Externalize South (make values visible and legible)
Elevate North (frame performance as identity, not just execution)
Maintain East–West as operational infrastructure
Company B:
Strengthen North (introduce performance and standards)
Introduce South (build a baseline trust layer)
Retain West as the primary acquisition engine
Conclusion
The Journey Compass is not a descriptive tool, but rather a diagnostic system.
It reveals how brands are built to grow, and how growth can become imbalanced, over time leading to market vulnerability. By mapping orientation bias across value, product, communication, experience, and culture, it surfaces the underlying system logic that traditional brand analysis often misses — particularly in categories where competitors appear similar but are structurally incompatible.
In the same market, these two brands illustrate a fundamental truth: One has built depth without amplification. The other has built amplification without depth. Both configurations contain strength, but neither contains completeness. Sustainable advantage requires an ongoing balancing act.
Sustainable advantage does not emerge from maximizing a single orientation. It emerges from coherent balance across all four directional forces, where system efficiency (East), performance clarity (North), experiential context (West), and identity meaning (South) reinforce rather than compensate for one another.
This reframes a central question of brand strategy.
It is no longer simply how should a brand position itself? It becomes:
“Is this brand structurally complete enough to sustain its own growth without distorting under scale?”
The Journey Compass provides a way to see that answer before the market does.
